A fad is an intense enthusiasm that is widely shared by the masses but it is short-lived. For instance, investing fads are usually the “newest” investing style in the market, which is usually unsustainable in the long run. Moreover, fad in the marketing sense is the behavior that develops on a large population due to the perception of popularity or coolness as deemed in social media or other forms.
By definition, being hooked on a fad is similar as being infatuated with a person for temporary period of time. Although, that does not stop you to spend bulks of money on fads! Avoid overspending by being aware of the ongoing fads in the Singapore market:
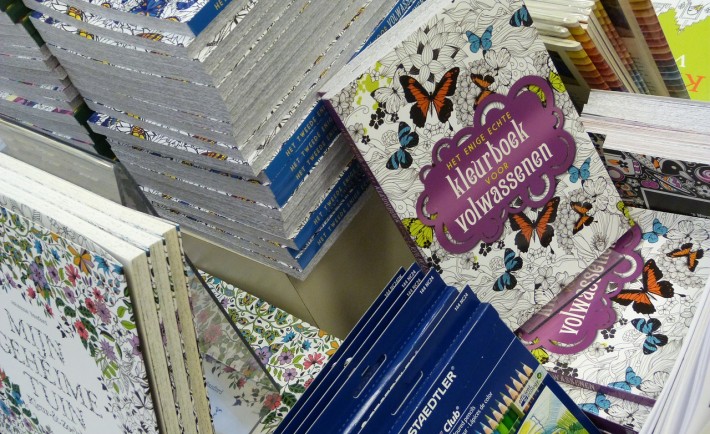
1. BOOK CRAZE
Remember when the Harry Potter or Twilight book series swept the nation by storm? This time, the book craze dates back from your childhood and it is none other than the coloring books! Coloring books, adult coloring books to be exact, have been increasing sales due to its social media following as the adults claim the coloring activity to be a great stress reliever. In Popular Bookstore, its price ranges from S$8.43-16.08.
2. FROZEN YOGURT
Frozen yogurt is gaining fame and does not show any signs of stopping at the time being. Companies such as Yami Yogurt, Sogurt, Berrylite, and Llao llao have been forming long queues in their stores especially the last one. Frozen yogurt is a famous product due to its healthy ingredients and high nutritional value. I shall focus on the Instagram famous frozen yogurt called Llao llao.
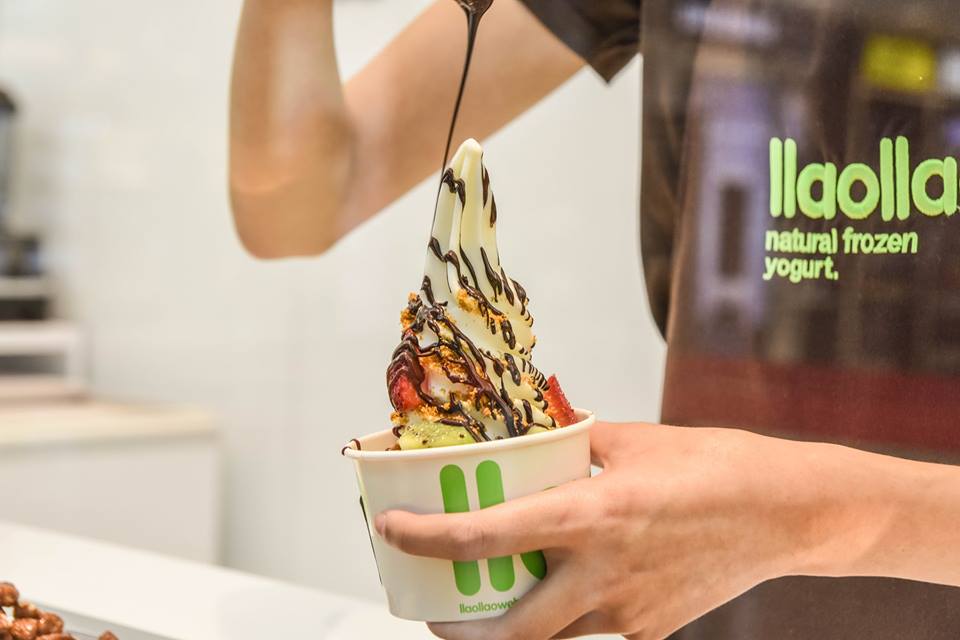
Image Credits: facebook.com/llaollaoSingapore
Llao llao’s frozen yogurt is made with skimmed milk and finest toppings. I can attest that their frozen yogurt is delicious and smooth. But, the price of their products on average is S$6. That is not so cheap especially if you keep coming back for more.
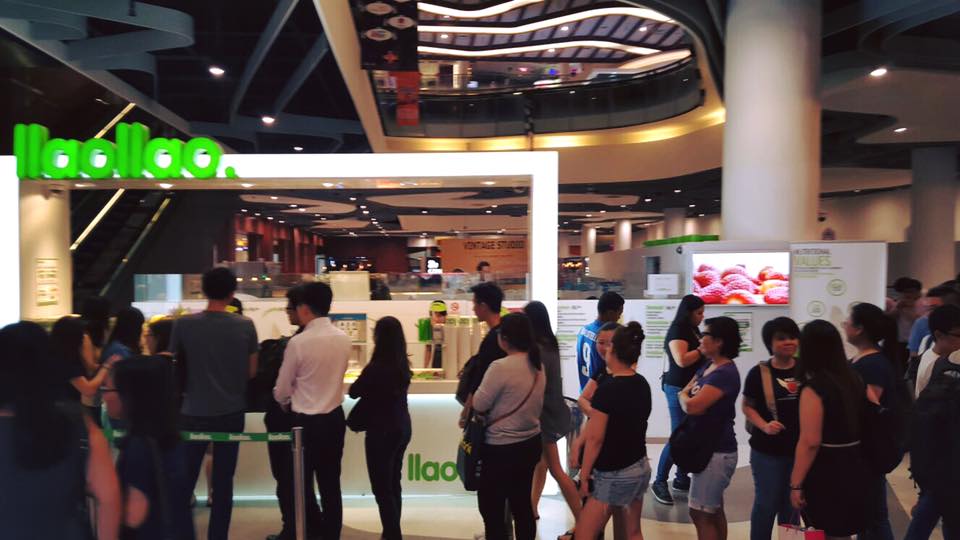
Image Credits: facebook.com/llaollaoSingapore
3. ENERGY DRINKS
Energy drinks are designed to give you the temporary boost you need for the day. It is popularly consumed in bars, restaurants, and gas stations. The energy drink brand that is gaining momentum in Singapore today is called “ok.-“. Ok.-‘s variety of flavors and colorful packaging speaks volumes to the urban lifestyle we live in. Furthermore, they marketed the brand in crowded places such as the Orchard Road. One pop is sold at about S$2.25. Imagine the effect on your pocket if you need the extra elevation everyday!
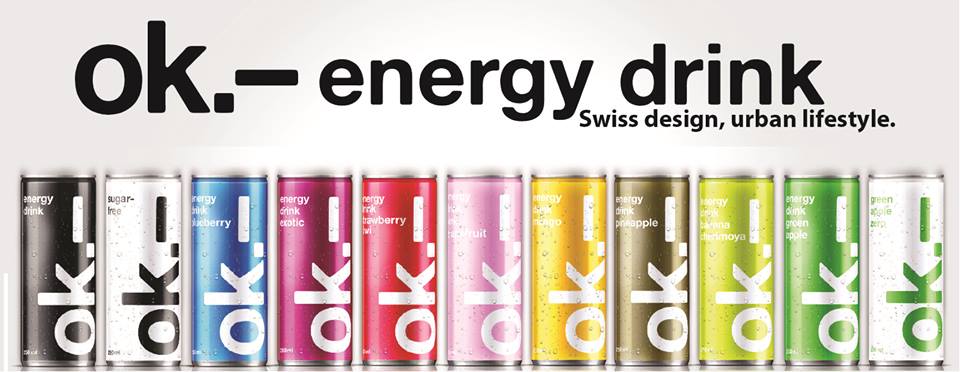
Image Credits: facebook.com/okoksg
4. FAD DIETS
Every fad diets claim to be the most efficient solution to losing weight and to becoming healthier. In the recent years, the famed diets include South Beach Diet, Paleo Diet, and Atkins Diet. Celebrities have sworn their lives to juicing and vegan diet. But what’s hot now is the combination of Vegan and Paleo Diet called Pegan. It is consisted of low-carbohydrates Paleo Diet (i.e., including meat, fish, and vegetables only), as well as fruits and vegetables from the Vegan Diet.

The problem to committing to these types of diets is the unnecessary price tags attached to it. For instance, you can purchase a juicer that ranges from S$49-800 just to make fine, smooth, and healthy juices each day. Organic produces are not that cheap too! Unless, if you purchase them from the budget-friendly groceries – here.