A technical analyst’s best friends are charts and patterns. But to the uninitiated, these are hard to make sense of. Once you get a hang of the basics however, your new-found knowledge can be used to search for potential investment opportunities.
The Assumptions
Before we get ahead of ourselves, let’s start from the beginning. What is technical analysis anyway?
Simply put, it is a study of past price movement patterns and market data to forecast future price movement directions that is built on 3 key assumptions:
1) Key factors are accounted for
The company’s fundamentals, broader economic factors and market psychology, are all priced into the stock, removing the need to consider these factors separately.
2) Prices follow trends
After a trend has been established, prices tend to move in the same direction.
3) History tends to repeat itself
This is because market participants tend to react consistently to similar market events over time.
However, it is important to remember that past performance is not necessarily indicative of future results. New factors or market conditions may arise which deviate from past trends and patterns.
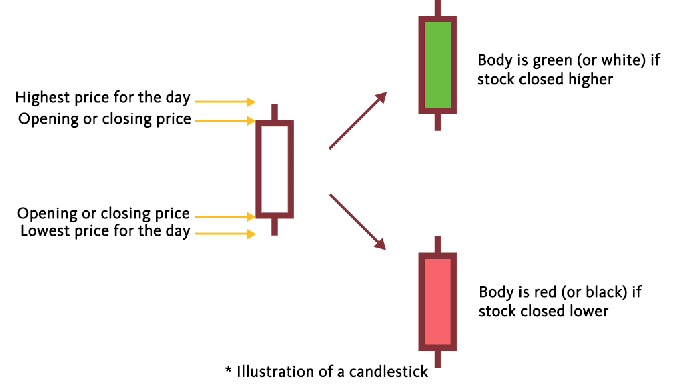
Candlesticks as Building Blocks
You can’t think about technical analysis without picturing a candlestick chart. It may surprise you to know that candlestick charts are not a modern-day invention. They have been used since the 1700s, having been introduced by Homma Munehisa, a rice merchant in Japan.
There must be something to candlesticks if they have been able to stand the test of time. And indeed, a single candlestick holds invaluable information which investors can distil at a glance:
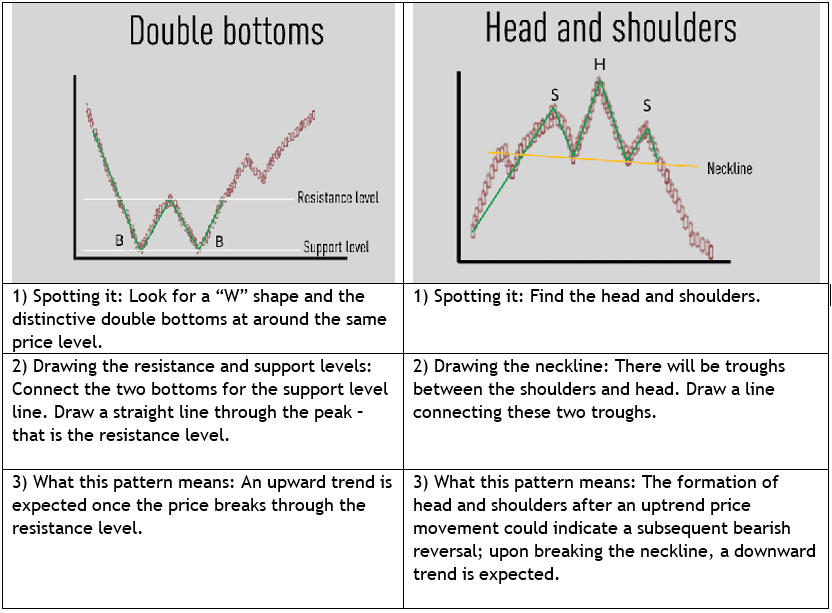
Spotting Patterns
Individual candlesticks can be strung together to form charts which technical analysts pour over, looking for patterns which give them trading ideas. However, you will have to understand how to spot these patterns and what they mean before you can capitalise.
Here are two simple patterns to ease you into things:
 Putting It Into Practice
These two patterns are just the tip of the iceberg. There are many other technical analysis patterns that you can learn about that may help you spot potential trading opportunities.
But even if you know what patterns to look out for, there is an entire universe of stocks to choose from. If you have no prior interest in any stock, it would be hard to know where to begin. It simply wouldn’t be efficient to look at charts of every single stock and find actionable patterns within.
One possible option is to use stock screeners to identify stocks that meet your own criteria. For example, a stock screener can help you find stocks like the one below that exhibited a head and shoulders pattern, during a specified period of time.
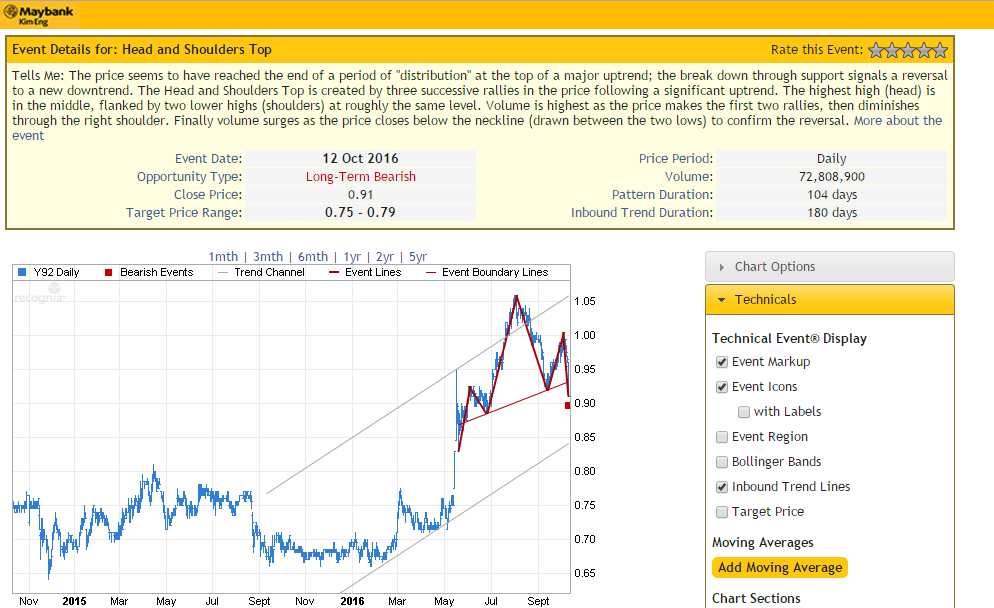
Source: Technical Insight on Maybank Kim Eng’s KE Trade platform
Technical analysis is useful for investors to understand. But like we highlighted earlier, it isn’t infallible and is built on several assumptions. Therefore, it is best to use technical analysis along with other tools in your investment toolkit, like fundamental analysis, and to practice often in order to gain a better understanding of how these strategies could help you meet your investment goals.