
You’ve probably heard about Technical Analysis from my previous articles and may be wondering to yourself, “How should I begin?” I feel that a great start would be learn about Trend Lines because it is the first step to knowing what Support and Resistance mean. You may wonder why is it important, and I hope that by the time you reach the end of the article, you would see it’s effectiveness and be convinced yourself. Perhaps, even try it out for yourself! I have been using trend lines faithfully and they have always served me well in my investments.
What are Trend Lines?
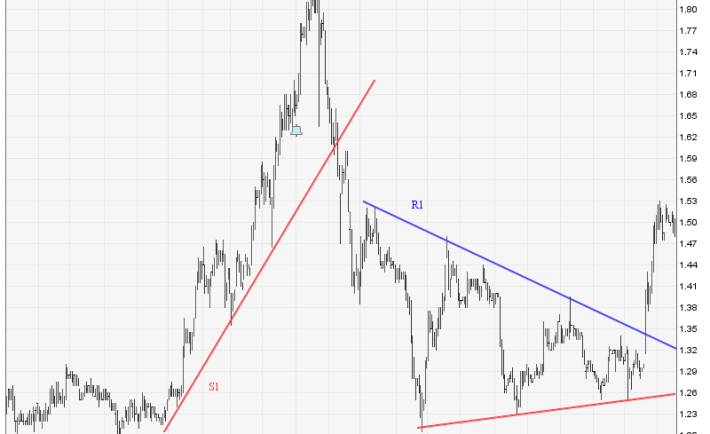
Trend lines are basically lines that you draw on charts that shows you the general direction of a trend. It is useful to help find potential support and resistance levels so you can time your entry and exit better. And the best part of it all, it’s not hard at all and can be performed on any charts! All you need to do is to find the best fit support or resistance line via trial and error by connecting the bottoms or tops of a trend. Here’s an example:
Here I have presented you with a chart that shows you two support lines (S1 and S2) and one resistance line (R1). It definitely doesn’t look too hard to draw isn’t it? Simply connect the bottoms of a trend and there you have it, a beautiful trend line that can help you spot the next bottom to enter your trade! You’ve always heard of people trying to “time the market”, this is one of the ways traders time their trade. Take for example the trade towards the right of the chart, at S2. Look at how easy it would have been for traders to time their entry and exit just by drawing two lines! Buy when it touches S2, and sell when it touches R1.
Trend Lines Keep Changing!
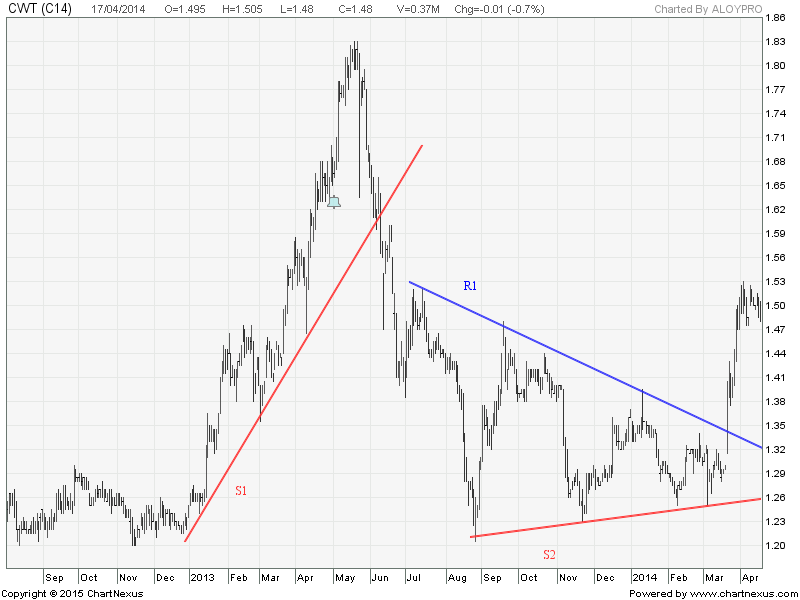
Had you not drawn the trend lines, would you have known at what price you should enter and at what price you should have exited at? Drawing trend lines help to clearly show where the next potential support and resistance will be at. I place emphasis on the word “potential” because it is not a guarantee that the trend will stay the same forever. Look at S1, it stayed in effect for about 6 months before the trend line is broken, and then we ignore S1 and move on to S2. Same goes for R1 where it was effective for 7 months before it was penetrated in mid-March. This penetrating move then renders R1 meaningless now while S2 is still in play because it hasn’t been breached.
It’s All About Practicing
I understand it can get a little confusing, but when it comes to trend lines, it is all about practice! Keep drawing and fine-tuning your accuracy when drawing these trend line because you will be rewarded at the end of the day! You can practice charting using the software I’m using, Chartnexus. (Note: I’m not receiving any commission for introducing this software from Chartnexus, it’s just that it has helped me a lot and I wanted to share with readers who are interested in Technical Analysis and it would help when I teach more about TA in the future.) Some of you may already have access to charts, do give it a try! Some charts are harder to have their trend line drawn and some are easier. Keep trying and eventually move to harder charts to improve your accuracy!
Disclaimer: The above chart is for learning purposes only and not a recommendation to buy or sell. Always conduct due diligence when making a purchase or sale of a stock.