Things to look out when investing in 2015

investing plans

An investment can often be effected by unforeseen circumstances. No matter whether it is a financial crash like in 2008 or a natural disaster like the earthquake in Japan – the market is never entirely save from unexpected disturbances. Therefore, expecting the unexpected will also be a credo for 2015. There is more to be considered. The global market seems surprisingly stable and might be able to excel further in 2015. But there are still a few things to keep in mind when putting your money in the market.

The oil price has fallen significantly within the last three months and even went to $53 US dollar on the last trading day of 2014. Although the supply has been reduced in order to stop the landslide, it doesn’t necessarily mean a halt for now. The oil price will most likely continue to affect the markets for a substantial part of the year. Sudden unforeseen events, like a military conflict or further overproduction, could trigger the oil price to go either way. This could therefore heavily disrupt an oil-dependent economy, such as Russia that is already unstable. When investing in 2015, one should consider to what extent the invested industry is subject to the oil price. If an investment is co-dependent on the rise and fall of the black gold, a seemingly stable share can fall rapidly just like the oil price and the Ruble did. Therefore, it is advisable to check the loose ends of your investments in order to see where they might get caught up in 2015.

The Federal Reserve in the US is said to raise the interest rate again later this year. Why is this interesting for anyone outside the US? At first glance it isn’t. But it is nonetheless a factor that one should keep in mind when investing internationally. Firstly, the raising of the FED interest rate can have a significant impact on the other markets in Asia and Europe. The markets are especially unstable in the days before the Federal Reserve is going to announce the raise. There is a good chance that shares will start to wager heavily for a short while. This might be a good chance to jump on some low prices before they will regulate themselves after the excitement around the interest rate has quietened down.

It might seem very obvious, but IT sector should not be left out of sight. Several shares are continuing to grow beyond everyone’s expectations. Certain stocks have been growing for more than five years straight and there isn’t an end in sight. That means not only that an investment in the IT and tech sector is potentially very lucrative and brings favourable returns, but is also a possible long-term investment that is crisis-safe. Tech shares have gained up to 20% and more in 2014. Charlie Morris from the HSBC Global Asset Management said that the tech sector will literally go ‘nuts’ this year. Stocks like Facebook, Google and Apple seem a very obvious choice – this is for a very good reason though. Investors have made profitable returns in the last years and will do so in 2015 as well. There are however more tech stocks to watch out for. Furthermore, paradoxically some tech indices have fallen throughout the year. They are predicted to take up speed this year again, as the tech stocks are gaining too. Therefore, the low prices of the tech indices offer an interesting opportunity to get involved and make reasonable profits. Even though the indices aren’t bringing as much return as perhaps Facebook and Apple, they still can be very beneficial for investors.

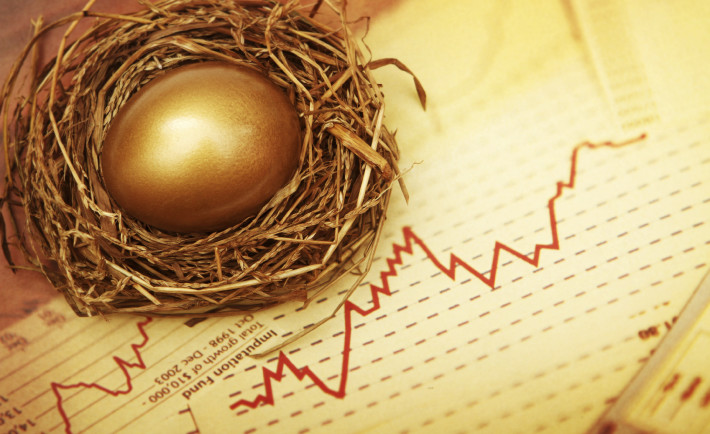
There are, however, certain investments one should be careful with, but definitely watch out for. One of those is gold. The price for the shiny metal has fallen to $1131,24 US dollar an ounce in November, which was the lowest in four years. Part of the reason for the drop is the US dollar, as gold is priced in the American currency. As the US dollar has become very strong throughout 2014 and risen to a seven-year high, the gold price went down. Furthermore, the price had suffered due to the low inflation. The latter is used as a hedge to prevent rising prices. This however makes gold more expensive in other currencies. However, there are analysts that predict the gold price could rise up to $1500 US dollar an ounce in the next years. Depending on the inflation rate, some even expect a raise to $3000 US dollar in the next ten years. This could mean a high potential benefit for investors in the long-term. Even though the very near future of the gold price might be rather slow, it seems very unlikely to fall substantially further. The demand for gold in China, India and other Asian markets is already growing and will continue in 2015. Jeffrey Nichols from Rosland Capital predicts a move of investments away from stocks and bonds back to gold. It seems that the signs are all set golden.

When investing within Europe, one should keep certain dangers in mind. The most prominent for numerous analysts is the political situation. If the UK was to vote on exiting the EU, the financial sector could be shaken up significantly. The European market has been suffering from a lack of trust for several years now. The rebuilding of faith in the industry has started, but remains slow. One should take the political instability in consideration when investing within the EU.

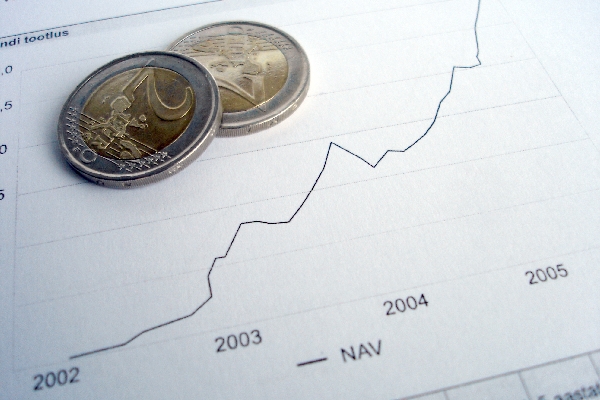
Although there isn’t much trust from the public and the politicians, the global financial market has recovered. Indicators such as the S&P 500 have gained over 12% throughout the year. Many analysts even claim the market is doing too well. Hence, there could be an instant eruption. Therefore, depending on your financial goal, it might be wise to only take the risks that are really necessary. The risk one takes with its investment should be matched by the financial aim of the investor. If risks are being taken then it is advisable to invest within one’s comfort zone. Don’t invest in what you don’t know.


Read More...

Fundamental Analysis: Guide on Ratios

There are many different areas to look at when performing fundamental analysis. One of the important things to look out for are the financial ratios of the company. These ratios provide a very quick overview of a company which I feel is great especially when filtering out companies! Ratios are easy to understand and it’s a very good place to start off for beginners trying their hands on fundamental analysis! There are many ratios out there and I have chosen a few that are easy to understand and meaningful to talk about which new investors can try their hands on!

Debt Ratio

IMG_3645.JPG
Debt ratio can be obtained by taking Total Debt/Total Asset or Debt/Total Equity. This shows you how leveraged a company is. Depending on the type of company, business cycle, and the industry the company is operating in, the debt ratio varies from industry to industry. For example, a company in the growth stage might have a high debt ratio because they need to borrow money to expand their business. Therefore, you need to take into account at what stage of the business cycle is in before you deem it over-leveraged.

Why I like to look at the debt ratio of a company first is because if I don’t feel comfortable with the sort of risk they are taking, then I don’t think it’s a business worth being in my portfolio. Every portfolio has a different risk tolerance and depending on your strategy, put in only the companies that you like and can understand.

Generally, my favourite types of companies are companies that have low to zero debt levels and remaining profitable. There are however, pros and cons to very low debt levels. The pros are obvious, the business is self-sustaining without need for additional cash to finance operations. The cons is that the company is not growing at it’s full potential. Debt is a leverage, a double-edged sword. If used right, it magnifies the gains. If used wrongly, it can potentially be the downfall of the company.

Liquidity Ratio

IMG_3646.JPG
Liquidity ratio of a company can be found by looking at either the company’s Current Ratio or Quick Ratio. Why these ratios are important is because they give you a sense of the company’s liquidity. When considering liquidity of a company, it’s all about the cash and cash equivalent. As we all know, cash is the lifeblood of any company. Without cash, a business simply cannot operate efficiently or pay off it’s debts. What results after is the potential liquidation of the company or having to resort to financing their short-term debts with high interest rates. This would then have a direct impact on the share price.

A ratio of >1 is generally good because if you look at the formula to calculate Current Ratio, Current Ratio = Current Asset/Current Liabilities. This means that the company likely has the capability to pay off their short-term obligations. What you need to look out for when considering companies to invest is when Current ratio is <1. It is an indication that the company has more obligations than it has in it’s current assets. However, always do look further into the numbers and balance sheets if you really think the company has potential. These ratios are more for preliminary scanning only and to be used only as a guideline.

Returns Ratio

IMG_3647.JPG
You may have always heard about people saying things such as ROA and ROE. These numbers are categorized as efficiency ratios. These ratios depicts the efficiency of the manager running the company. It shows how well the company is at generating returns in terms of it’s Assets(ROA) and Equity(ROE). Generally, the higher these ratios are, the better. Because if an efficient manager can utilize what they have so well, they can do so much more when more money is given to them to invest in the company’s assets and further growth of the company as well as maximize returns for investors.

My eyes would open up whenever I see a company having double-digit ROA and ROE because it speaks well of the people running the company. They must have been soon something right. Of course, always take note if these ratios are sustainable or not and not simply a one-off occurrence. Again, these ratios can be very easily retrieved from SGX’s website which helps greatly when you are doing your research.

Concluding

I hope this post would help you to start off your first fundamental analysis of your investment journey. There are many ratios out there but I felt that these are the few easier ones to understand and to apply. Keep reading, find out more information and understand in greater detail the things you already know! As they say, “Knowledge is power” and it is the same knowledge that will make you profitable as well!

Read More...

Why it makes sense to contribute to the SRS account (to a certain extent)

SRS Account Singapore

Supplementary Retirement Scheme (SRS), as the name suggests, is a plan designed to help fund your retirement besides the CPF. It forms one of the multi-pronged approach by the government to help tackle the problem of a silver tsunami that Singapore is facing.

SRS is a voluntary scheme which offers tax benefits in the form of a tax relief for every dollar you contribute up to a maximum of $12,750 per year. There is no minimum amount and you are free to contribute any amount to your account with any of the SRS operators: DBS, OCBC & UOB.

You can also invest the amount in SRS in a variety of instruments such as stocks, bonds, unit trusts, fixed deposits, insurance and many more. You also have the option to keep them as cash which give you a meagre return of 0.05% per year.

One thing to take note is once you have decided to fund your SRS, any premature withdrawal before the statutory retirement age (currently at 62), there is a 5% penalty fee and 100% of the amount withdrawn is taxable.

If you have the discipline to keep it till the statutory retirement age, good news is only 50% of the withdrawals from SRS are taxable or what they call it as a 50% tax concession. And you can spread the withdrawal over a period of 10 years.

In other words, if you have manage to accumulate $400,000 in your SRS at retirement, you can strategically withdraw it over 10 years, i.e $40,000 a year – to pay zero tax. (Since only 50% of the $40,000 is taxable and the first $20,000 is not taxable.

In the cumulative SRS statistics published by MOF, less than half of the account holders are aged between 21 – 45 in December 2013. Only 11% of those those aged between 21 – 35. While it is understandable that these group of people are financially strapped due to family commitments, it would be wise to apportion at least part of their income to SRS to enjoy tax benefits.

While some may argue that the tax benefits are merely deferred and locking your cash up till the statutory retirement age of 62 is not attractive, a closer look into the numbers may prove otherwise.

Let’s take a look into a few scenarios, making certain assumptions.

1. 32 years old earning $50,000 a year

For someone who is taking home $50,000 a year, the tax payable is $1,250 ($550 for the first $40,00 + 7% of the next $10,000)

If he/she decide to fund the maximum SRS amount of $12,750, the taxable income would be reduced to $37,250 and the tax payable is therefore $453.75 ($200 + 3.5%*$7,250). The amount of tax saving amounts to $796.25.

a. If he/she decide to contribute all the way to 62 (30 years)

Assuming a growth of 8%, the SRS account would be sitting at a value of $1,444,360.94. There are many different way on how the withdrawal can be made. For now, let’s take it as an equal drawdown over 10 years, or $144,436 per year. Half of this amount is taxable which is $72,218. With a tax rate of $550 for the first $40,000 and 7% for the next $32,218, we get $2,805.26 of tax.

You might think that’s a huge amount ($28,052.60) considering that you have to pay it over 10 years and it is something which you could avoid should you not contribute to SRS as capital gain on shares are not taxable.

But let’s not forget that you also save $796.25 of tax per year for 30 years (assuming same income and tax rate), and should you have been more responsible with your finance to grow these extra savings at a modest rate of 4%, these savings would miraculously amounts to $44,657.63. That’s not too bad isn’t it?

The only drawback is you cannot withdraw from your SRS before the statutory retirement age without incurring any penalty fee.

b. If he/she only made a one time contribution of $12,750

Again, let’s assume growth is at 8%, $12,750 of contribution will grow to $128,298 in 30 years. This amount by itself will not be taxed if you are wise enough to spread the withdrawal over 10 years. (or 4 years)

Don’t touch it for 30 years? For a humble amount of $12,750, i will take it. Tax savings? $796.25. Opportunity cost saved? $8,021 at 8%, or $2,583 at 4%.

2. 32 years old earning $150,000 a year

For income earner in the higher tax bracket, the tax benefit are more evident than those in the lower bracket.

Tax payable without SRS: $7,950 for the first $120,000 + 15% of $30,000 = $12,450

Tax payable, contributing $12,750 to SRS: $7,950 for the first $120,000 + 15% of $17,250 = $10,537.50

Tax saving: $12,450 – $10,537.50 = $1,912.50

a. If he/she decide to contribute all the way to 62 (30 years)

Same as (1), you will be taxed at $2,805.26 per year for 10 years.

Which will you choose? Save $1,912.50 per year for 30 years or $2,805.26 per year for 10 years?

It’s a no brainer.

b. If he/she only made a one time contribution of $12,750

Do i even need to calculate this?

So is SRS a sure win?

The thing to note in both examples is if you have other income sources at your retirement and say it adds up to $150,000. This would have cost you $12,450 of tax. If you add your SRS’s taxable amount of $72,218, you may end up in the higher bracket with $222,218 of chargeable income. Doing the maths, your tax payable end up to be $24,749.24. ($12,300 of additional tax per year for 10 years) More than what you would have saved from the tax.

In addition, your children will not be able to claim for ‘Parent relief’ since your income is definitely more than $4,000 a year. (But look, i can’t fathom the idea of someone retiring with less than $4,000 of income in a year anyway)

Some may also argue that you can make a cash top-up to your CPF and enjoy a risk-free rate of 4% in your Special or Retirement Account. (Currently with a $7,000 cap for yourself and $7,000 for your family members)

There are many other scenarios which may throw SRS out.

But the trick here is to keep the value of your SRS within the lower tax bracket while maximising the tax benefits on the other hand. (A yardstick of $440,000 will not cost you any tax since you can spread $400,000 over 10 years and the remaining $40,000 is not taxable once it is reduced by 50%)

I am also assuming you will not be letting your money sleep in your SRS account. You need to make it work harder than the 0.05% that the banks currently offer while managing the exposure to your risk and age profile.

An option is to consider using your SRS to buy into the STI ETF.

READ ALSO: How to invest in STI ETF?

Everyone has a different profile and trying to assert a one-way-fits-all approach is akin to forcing your feet to fit into my US 8 sneaker.

Now that you know what is SRS, go do your maths and work out if it makes sense to contribute to the SRS or you can discuss them in the forum here: http://www.moneydigest.sg/forums/index.php?threads/does-it-makes-sense-to-contribute-to-srs.308/


Read More...

7 Deadly Investment Sins

The definition of INVESTMENT is as follows: it is money committed or property owned that is acquired for future income. It has two main classes namely: fixed income (e.g., bonds or fixed deposits) and variable income (e.g., property ownership).

Mark Tier, the author of “The Winning Investment Habits of Warren Buffett & George Soros”, argues that they are seven deadly investment sins that unwary investors make.

What is observable with these so-called sins is that they are all irrational investment beliefs. Once you clear your judgment, you can make better financial choices.

SIN #1. BELIEVING YOU NEED TO PREDICT THE MARKET’S NEXT BIG MOVE

Warren Buffett does not believe in predicting the market’s next big move and nor does he care about it. He says that “forecasts may tell you a great deal about the forecaster; they tell you nothing about the future”.

SIN #2. GURU BELIEF

Some people are tempted to listen to “money gurus” that are believed to predict the market. “Media gurus” make their money from discussing about investments, selling their advice or charging fees to manage other people’s money. But, their followers are not all rich. If you could predict the market’s future, wouldn’t you shut your mouth and make a pile of money yourself?

SIN #3. “INSIDE INFORMATION” IS THE WAY TO MAKE REALLY BIG MONEY

Study the companies’ annual reports as Warren Buffett did. He, along with George Soros were once unknown in the investment scenes and now they are making a significant amount of money. You can work your way up the ladder without having to pay for inside information.

SIN #4. DIVERSIFYING

The source of Soros’s success is exactly the same as Buffett’s: a handful of investments that produce huge profits. Knowing the right companies to allocate your money to takes guts, wits, and luck.

SIN #5. TAKE BIG RISKS IN ORDER TO MAKE BIG PROFITS

Like entrepreneurs, successful investors know it is easier to lose money than it is to make it. This is why…they are more concerned with not losing money that making them.

SIN #6. SYSTEM BELIEF

Some people believe that a certain “system” can guarantee investment profits. It is human nature to find patterns and look for the formula. But, by doing so, you are just flushing your money down.

SIN #7. BELIEVING YOU KNOW THE FUTURE AND BEING CERTAIN THAT THE MARKET WILL PROVE YOU RIGHT

This is far more tragic than just believing you can predict the future. The investor who falls under the spell of the seventh deadly investment sin thinks he already knows what the future will bring. Hence, he or she might gamble it all and eventually lose everything.

Image Credits: reynermedia via Flickr

Image Credits: reynermedia via Flickr

These sins tempt investor and cost them an awful lot of money. This is why it is tantamount to avoid these cognitive illusions. 

Sources: Business Dictionary and Wealth Creator

Read More...

Undestanding the Total Debt Servicing Ratio (TDSR) in Singapore

TDSR Singapore

If you are planning to buy your first property, you will be made to get accustomed to a term call “TDSR” or Total Debt Servicing Ratio (besides SIBOR, LTV and the likes) introduced on 28 June 2013. Not surprisingly, 1 in 3 home buyers are not familiar with how the TDSR works.

TDSR is one of the 8 rounds of property cooling measures enforced the the Monetary Authority of Singapore (MAS) since the financial meltdown of sub-prime crisis in 2008.

It has been more than a year since it was implemented and has since impacted the property market in Singapore, dampening demands and preventing housing price to go out of control.

What is TDSR?

To ensure financial prudence in borrowers, a framework is set to ensure that a borrower cannot has a outstanding debt repayments more than 60% of his gross income. This not only prevent home buyers of excessive gearing, it also ensure that financial institutions (FIs) are able to manage their credit risk appropriately.

Outstanding debt repayments encompasses ALL your financial liabilities which includes and are not limited to: student loan, credit card debt, car loan, personal loan, etc.

When your overall debts cannot exceed 60% of your gross income, it also means that if you are earning a gross income of $3,000 a month, your total debts cannot exceed $1,800 (60% of $3,000). That is to say if your existing outstanding debts amount to $1,000, your mortgage repayment should not exceed $800 – calculated with the higher of actual interest rate or 3.5% (for residential properties) or 4.5% (for non-residential properties). On top of that, there is a Mortgage Servicing Ratio (MSR) of 30% that stipulates that the amount that goes to service your mortgage should not exceed 30% of your income. In this case, your maximum allowable repayment is $900 (30% of $3,000).

You can use the TDSR calculator from UOB to calculate your home loan.

* If you are a variable income earners (e.g commissions, bonus), there is a 30% haircut which means only 70% of the income is used in the calculation of TDSR.

Why is there a need for TDSR?

With low interest rate and growing investment appetite, coupled with excess capital liquidity – it could be an eerie reminiscent of the housing bubble in 2006 which eventually goes burst and causes mayhem. Fortunately, Singapore has various cooling measures which include a limit on the maximum loan tenure, loan-to-value limits and imposing stamp duties such as the Additional Buyer Stamp Duty (ABSD) and Sller Stamp Duty (SSD) and has managed to curb inflating property prices. There is also a stricter liquidity rule which requires bank to hold quality liquid assets such as cash and government bonds to withstand an intense 30-days shock witnessed in the 2008 crisis.

What happens after several rounds of cooling measures?

As one would have expected, property prices has been heading south and dampening demands has led to many unsold units. The URA’s Private Residential Property Price Index has fallen for the fifth consecutive quarters in the latest URA’s flash estimate published in 2 January 2015. For the entire year of 2014, prices has fallen by 4%. There are anecdotal evidence that if prices fall by 10%, Singaporeans have the liquidity and means to snap up the units!

Housing loans has just increased by 6 per cent in September 2014 from a year ago, a stark contrast of the peak of 23 per cent in August 2010.

The property market is still lackluster and Minister Khaw Boon Wan seems adamant to keep the property cooling measures, home buyers may find themselves landing a good deal with 50,000 new units to be completed over the next 2 years.


Read More...