Technical Analysis – The answer to “When to buy?”

Why Should I Consider Technical Analysis?

For questions like “What to buy?” requires fundamental analysis. But when someone asks, “When to buy?” This is when technical analysis comes into play. Technical analysis is the other approach of investing. When you talk about technical analysis, you’re looking at things like charts, chart patterns, technical indicators, etc. It gives you a visual information about how the stock price moves for the minute, the hour, the day, week and even month! This information is useful because it can give you a better sense of how the stock is doing right at the moment. Fundamental analysts usually have to deal with information that isn’t updated because company reports would only come out quarterly, or even annually! Many things happen in between the quarters but you could possibly be trading based on the previous quarter’s results which may no longer be relevant.

Pure technical analysts are not interested in the research of a company’s fundamentals because the way a stock price moves would have indicated how much everyone thinks the stock is generally worth. When an undervalued stock moves because it was uncovered by a fundamental analyst, it wouldn’t be missed by technical analyst who watch price-volume action of a share price. As long as a stock moves, the technical analysts will be there watching it as well! Price movements can give a technical analyst a lot of information such as breakouts, psychology of the market players, trend, reversal patterns, etc. These days, there are a lot of people relying on charts when buying a stock. You would only be putting yourself in a disadvantaged position if you choose not to avail yourself to the same information they are receiving. With more and more speculators in the market, fundamentals might be ignored for short moments and only technical analysis can help you for the moment to be profitable.

Here’s an example:

chart (14)

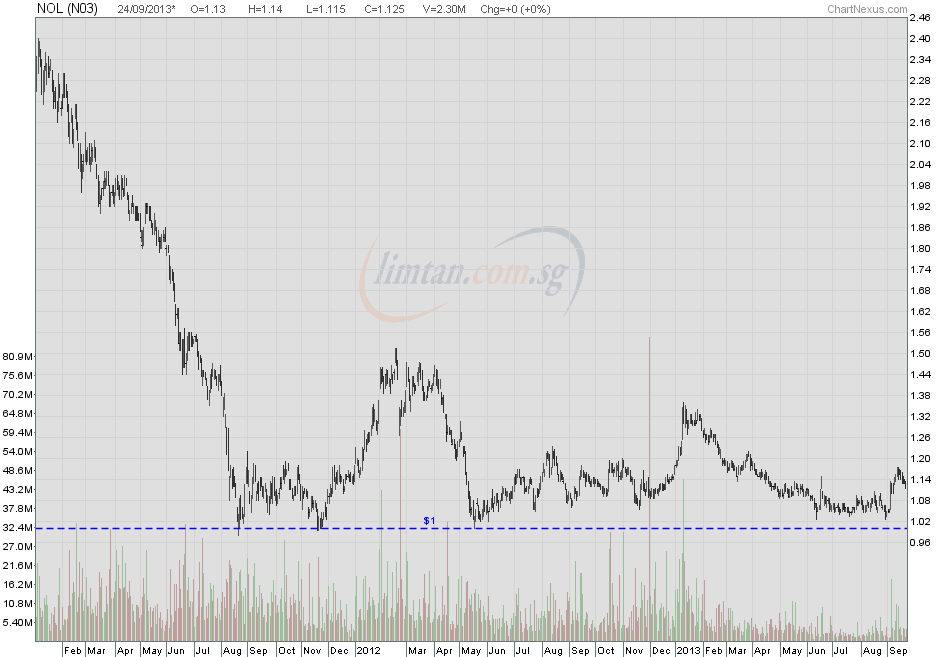
A pure fundamental analyst would not know where the support or the resistance is. He would know what the company should be valued at but he may not know when is the best time to enter. For example, NOL is down-trending from $2.30. A fundamental analyst values it at $1.50 based on Price-Book ratio, P/E ratio, or other metrics available to him. When NOL sells down to $1.50, the fundamental analyst would make the purchase because he thinks that is what it is worth. However, from a technical analyst point of view, he would wait to see if $1.50 is supported or not. If the price is not supported, he waits for the share price to continue falling and test the next support level at $1. When share price eventually gets to $1 and shows that it is supported with a high volume, the technical analyst buys it.

At the end of the day, both analysts got NOL, but the technical analyst got a better price because he knows that from past price movements that $1 is a strong psychological support and buys it at a support instead of simply buying it because he thinks that is what it is worth. Past price actions can give you a hint about the future price movement because of many reasons, largely psychological support and resistance levels. The fact is that many people are relying on such information, and if you aren’t, you will lose out and the market will not make sense to you. Having a visual image of how the stock market is going will be very much easier for you to find support levels such as in the case above.


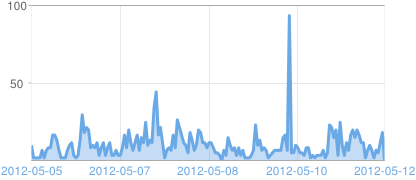
Of course, this is not to say that technical analysis is 100% accurate and gives you pin-point accuracy. What it can provide you is more information that opens up your eyes to more opportunities for buying entries. There is always a time an investor will face where he says “I’m waiting for the right time to enter”. It could be a fundamentally sound company but simply trading too expensively and this is when technical analysis will tell you when the right time is. Or rather, give you a hint of when the right time is. Of course, hindsight is 20/20 and the chart above could have gone in a totally different direction and crashed through $1 rather than stay supported on 2 more counts on Nov 2011 and May 2012. I used an old chart for the purpose of effectively sending my point across rather than try to teach based on current prices where even I don’t know where the future is. No one can predict how the future price will move, they can only get a vague idea of it. By effectively utilising both fundamental and technical analysis, you would put yourself in a profitable position where the odds of a profitable trade is higher.

Important Disclaimer

The above chart is for teaching purposes only and is not a recommendation to buy/sell.

Read More...

Fundamental Analysis: Guide on Ratios

There are many different areas to look at when performing fundamental analysis. One of the important things to look out for are the financial ratios of the company. These ratios provide a very quick overview of a company which I feel is great especially when filtering out companies! Ratios are easy to understand and it’s a very good place to start off for beginners trying their hands on fundamental analysis! There are many ratios out there and I have chosen a few that are easy to understand and meaningful to talk about which new investors can try their hands on!

Debt Ratio

IMG_3645.JPG
Debt ratio can be obtained by taking Total Debt/Total Asset or Debt/Total Equity. This shows you how leveraged a company is. Depending on the type of company, business cycle, and the industry the company is operating in, the debt ratio varies from industry to industry. For example, a company in the growth stage might have a high debt ratio because they need to borrow money to expand their business. Therefore, you need to take into account at what stage of the business cycle is in before you deem it over-leveraged.

Why I like to look at the debt ratio of a company first is because if I don’t feel comfortable with the sort of risk they are taking, then I don’t think it’s a business worth being in my portfolio. Every portfolio has a different risk tolerance and depending on your strategy, put in only the companies that you like and can understand.

Generally, my favourite types of companies are companies that have low to zero debt levels and remaining profitable. There are however, pros and cons to very low debt levels. The pros are obvious, the business is self-sustaining without need for additional cash to finance operations. The cons is that the company is not growing at it’s full potential. Debt is a leverage, a double-edged sword. If used right, it magnifies the gains. If used wrongly, it can potentially be the downfall of the company.

Liquidity Ratio

IMG_3646.JPG
Liquidity ratio of a company can be found by looking at either the company’s Current Ratio or Quick Ratio. Why these ratios are important is because they give you a sense of the company’s liquidity. When considering liquidity of a company, it’s all about the cash and cash equivalent. As we all know, cash is the lifeblood of any company. Without cash, a business simply cannot operate efficiently or pay off it’s debts. What results after is the potential liquidation of the company or having to resort to financing their short-term debts with high interest rates. This would then have a direct impact on the share price.

A ratio of >1 is generally good because if you look at the formula to calculate Current Ratio, Current Ratio = Current Asset/Current Liabilities. This means that the company likely has the capability to pay off their short-term obligations. What you need to look out for when considering companies to invest is when Current ratio is <1. It is an indication that the company has more obligations than it has in it’s current assets. However, always do look further into the numbers and balance sheets if you really think the company has potential. These ratios are more for preliminary scanning only and to be used only as a guideline.

Returns Ratio

IMG_3647.JPG
You may have always heard about people saying things such as ROA and ROE. These numbers are categorized as efficiency ratios. These ratios depicts the efficiency of the manager running the company. It shows how well the company is at generating returns in terms of it’s Assets(ROA) and Equity(ROE). Generally, the higher these ratios are, the better. Because if an efficient manager can utilize what they have so well, they can do so much more when more money is given to them to invest in the company’s assets and further growth of the company as well as maximize returns for investors.

My eyes would open up whenever I see a company having double-digit ROA and ROE because it speaks well of the people running the company. They must have been soon something right. Of course, always take note if these ratios are sustainable or not and not simply a one-off occurrence. Again, these ratios can be very easily retrieved from SGX’s website which helps greatly when you are doing your research.

Concluding

I hope this post would help you to start off your first fundamental analysis of your investment journey. There are many ratios out there but I felt that these are the few easier ones to understand and to apply. Keep reading, find out more information and understand in greater detail the things you already know! As they say, “Knowledge is power” and it is the same knowledge that will make you profitable as well!

Read More...

3 Tips to Performing Fundamental Analysis

You may have already known that there are two ways to analyse a company, fundamental and technical. In this post, I will be focusing on fundamental analysis and zoom into the things that are commonly looked out for when performing such analysis.

For a start, it would be good to have a foundation on basic accounting and financial accounting since you will be looking into Income Statements and Balance Sheets. Fundamental analysis is all about making sense of the numbers to give you meaningful information that can profit you.

Compare Against Past Data

track-record_02

When I first begin my analysis, I look at the latest financial statements released by the company. I simply look at their financial highlights to see what happened in the recent quarter if it’s a company that I’ve never researched on before. These numbers alone are not enough to tell you about the performance of the company. Always compare your numbers, quarter-on-quarter or year-on-year as some company businesses are cyclical in nature and what may seem to be a spike from the previous quarter may actually be normal or underperforming. This is one of the reasons why sometimes you may see companies report that their profits rise, but share price still falls. When you compare against past datas, you can also see trends which might help you to forecast the upcoming results and what you can expect will happen. These datas can be obtained from SGX’s website, which makes obtaining data or information really easy!

Look Out For Unusual Spikes Or Abnormalities

chart1

The numbers won’t lie. Thanks to FRS regulations and many other accounting regulations, companies must be transparent when reporting their results. You will notice that some numbers experience tremendous growth and these could be important or significant figures. This could be a spike in net profit margin, etc. It is then when you should open up your eyes and find out what is going on. There should be some questions that go through your mind as you see spikes. “Is it a one-off spike? If so, what is the impact?” Always question the numbers because this is where you can draw meaningful information out of it. Being able to discern what the information means can help you to gain a deeper understanding of the company and possibly give you a glimpse into the future of the company such as new projects, acquisitions, etc.

Financial Ratios

7690682096-f74fab9320


This is where your financial accounting will help you out. However even if you don’t have a financial accounting background, not to worry because these days the ratios are given to you already. Knowing how to calculate the different ratios and understanding the impact of a high or low ratio will give you that extra edge against other investors who do not know what the ratios mean. The few ratios that I like to look out for are Debt Ratio, Return (Efficiency) Ratio and Liquidity Ratio. These ratios are a way to make a better sense of the numbers that you see on the income statement or balance sheet. This is drawing out meaningful information from face value information. Do remember that these ratios are not one-size-fits-all. Different industries have different norms and you will have to take account of that. Always do a cross-comparison with other companies in the similar industry to get a rough gauge of what the norm is.

In A Nutshell..

There are a lot of information flowing around that we have access to. Simply put, it is how we make sense out of the information and taking the right steps to profit from the information given to us. All of this takes time to learn and it’s a never-ending journey of learning. Do not be too overwhelmed by the things that you have not learnt yet if you are just starting out, and take things one step at a time. Over the weekends, pick up a book in the library and expand your knowledge on the subject. Or you could also simply google the questions you have in mind. Even better, ask your friends who are already in the know. Investing is a journey to requires one to keep learning and improving. This is a long journey that will be worth it at the end!

Read More...

A Simple Guide to Analyse Companies

“How to analyse a company?” – This is a question that almost every new investor will ask. Especially for first-time investors, this can be a very daunting task, where does one begin? Without proper financial education and experience, it is definitely hard to know what are the signs of a good or bad company.

There are 2 ways to analyse a company.
1) Fundamental Analysis
2) Technical Analysis


fundamental-vs-technical-analysis-680x365


Fundamental Analysis

What are the differences you may ask. Fundamental analysis looks at both the macro and micro economics. We look at the prospects of the industry and the way the business positions itself to grow. Fundamental analysis looks into the financial statements (Income statement & Balance sheet) and dives into all the nitty gritty details of the company such as management, business model, etc. This the type of analysis that Warren Buffet and many other value investors subscribe to. A company with good fundamentals will stand strong through the test of time and be able to ride through the market cycles. Couple a company with good fundamentals and at the right valuation, you’ll be paid off handsomely for your labour. When you do your research, you are taking calculated risk and you avoid exposing yourself to taking on unnecessary risks that may not want to take on. Investing is not simply buying or selling, it requires making sense of the ocean of numbers you see. When first starting out, I can assure you that it’s information overload and all you see are numbers that do not make sense. Give yourself time, start with one set of numbers at a time and with practice, you will eventually be able to make sense of everything!

Technical Analysis

Technical analysis on the other hand, is more focused on the entry and exit timing when trading. Pure technical analysis will ignore the fundamentals of a company. These are the people who looks at charts, chart patterns, price-volume action and technical indicators. They also tend to enter and exit a trade very quickly because they are riding on the hype of the market. A company without solid fundamentals may rise due to speculators buying up the share prices hoping the next fool buys it higher. But these stellar movements will not sustain without fundamentals just like how a skyscraper needs a solid foundation. They will not stand the test of time and will come crashing down as shown by the not-so-recent crash of the trio (Asiasons, Blumont, LionGold). However, let’s not discredit technical analysis just yet. Technical analysis has a lot of advantages and can give you hints of when the stock will move in a certain direction. Every single bit of information in investing is important and the one who has the most accurate information is the one who profits. I urge you to keep an open-mind about technical analysis because although it starts off confusing, just like with every other thing, it will reward you just as well.

Combining the best of both worlds

Allow me to introduce you the third style. This combines both technical analysis and fundamental analysis. This is perhaps a more mixed up approach, which attempts to take the best of both worlds of investing and trading. Personally, I subscribe to this style of investing because I believe that a company with good fundamentals can get cheaper for external reasons such as poor market sentiments, short-term fluctuations, etc. This is when good fundamental analysis meets good technical analysis; to be able to buy fundamentally good companies at the cheapest price with the given opportunity. This style of investing is especially useful when investing in companies for their dividend yield. Dividend yield can be affected by two factors, the dividend payment and the share price. Take for example a company like SingPost, it gives out the same dividend year after year since 2006, 6.25c. The only way to get a better dividend yield out of it is to purchase it at a lower share price. This is where I feel having good technical analysis skills come into play. To be able to spot the bottom of price movements allows you to get better yield. I believe that even good companies can get even cheaper due to external reasons which are short-term in nature. You would effectively be able to apply the “Buy low, sell high” concept as well as value investing. Take time to learn and understand both ways of analysis and you will come out a better investor at the end of the day!

Read More...